Biological Systems Engineering Dept.
Washington State University
The model code is written in Pascal (DOS version) and C++ (Windows and Windows 95 versions). An advanced user-friendly interface allows users to easily manipulate input files, verify input parameters for range errors and cross compatibility, create simulations, execute single and batch run simulations, customize outputs, produce text and graphical reports, link to spreadsheet programs, and even select a preferred language for the interface text. Simulations can be customized to invoke only those modules of interest for a particular application (e.g., erosion and nitrogen simulation can be disabled if not desired), producing more efficient runs and simplifying model parameterization. The model is fully documented (Stockle and Nelson, 1994, Stockle and Nelson, 1996) , and the manual is also available as a help utility from the CropSyst interface. CropSyst executable program, manual, and tutorials can be retrieved directly over the Internet (http://www.bsyse.wsu.edu//CS_Suite)
The water budget in the model includes precipitation, irrigation, runoff, interception, water infiltration, water redistribution in the soil profile, crop transpiration, and evaporation. Users may select different methods to calculate water redistribution in the soil profile and reference evapotranspiration. Water redistribution in the soil is handled by a simple cascading approach or by a finite difference approach to determine soil water fluxes. CropSyst offers three options to calculate grass reference ET. In decreasing order of required weather data input, these options are: the Penman-Monteith model , the Priestley-Taylor model , and a simpler implementation of the Priestley-Taylor model which only requires air temperature. Crop ET is determined from a crop coefficient at full canopy and ground coverage determined by canopy leaf area index.
The nitrogen budget in CropSyst includes N transformations, ammonium sorption, symbiotic N fixation, crop N demand and crop N uptake. Nitrogen transformations of net mineralization, nitrification and denitrification are simulated. The water and nitrogen budgets interact to produce a simulation of N transport within the soil. Chemical budgets (pesticides, salinity), including pesticide decay and absorption, are also kept and interact with the water balance. All balances within the model are check at each time step and errors are reported in case of departures within set threshold values.
Crop development is simulated based on thermal time required to reach specific growth stages. The accumulation of thermal time may be accelerated by water stress. Thermal time may be also modulated by photoperiod and vernalization requirements whenever pertinent. Daily crop growth is expressed as biomass increase per unit ground area. The model accounts for four limiting factors to crop growth: water, nitrogen, light, and temperature. Given the common pathway for carbon and vapor exchange of leaves, there is a conservative relationship between crop transpiration and biomass. Following Tanner and Sinclair (1983), daily biomass accumulation is calculated as:
where BT is the transpiration-dependent biomass (kg m-2 day-1), T is actual transpiration (kg m-2 day-1), and VPD is the mean daily vapor pressure deficit of the air (kPa). The Tanner-Sinclair relationship has the advantage of capturing the effect of site atmospheric humidity on transpiration-use efficiency. However, this relationship becomes unstable at low VPD; indeed it would predict infinite growth at near zero VPD. To overcome this problem, a second estimate of biomass is calculated following Monteith (1977):
where BL is the light-dependent biomass (kg m-2 day-1), e is the light-use efficiency (kg MJ-1) and IPAR is the daily amount of crop-intercepted photosynthetically active radiation (MJ-1 m-2 day-1). Each simulation day, the minimum of B T and BL is taken as the biomass for the day.
Although the parameter e (Eq. 2) includes the effect of the temperature regime prevailing during its experimental determination, temperature limitations during early growth are not captured and a single value is determined for the vegetative period or, more usually, for the entire growing season. However, more detailed measurements will show a decrease of e during early growth due to low temperature. Not accounting for this temperature effect may result in overprediction of biomass during early growth, particularly in the case of winter crops. A temperature limitation factor is included in CropSyst to correct the value of e during this period, which is assumed to increase linearly from zero to one as air temperature fluctuates from the base temperature for development to an optimum temperature for early growth.
To account for nitrogen effects on biomass, the minimum of BT and B L is used as base to determine the nitrogen-dependent biomass (BN ):
where BN is in kg m-2 day-1, Np is plant nitrogen concentration (kg kg-1), Npcrit is the critical plant N concentration (kg kg-1) below which growth is limited, and Npmin is the minimum plant nitrogen concentration (kg kg-1) at which growth stops. The values of Npcrit and Npmin (and also of maximum plant nitrogen concentration, needed to establish crop nitrogen demand) fluctuate as a function of accumulated biomass, following the concept of growth dilution. More detail on this is given by Stockle and Debaeke (1996).
The increase of leaf area during the vegetative period, expressed as leaf area per unit soil area (leaf area index, LAI), is calculated as a function of biomass accumulation, specific leaf area, and a partitioning coefficient. Leaf area duration, specified in terms of thermal time and modulated by water stress, determines canopy senescence. Root growth is synchronized with canopy growth, and root density by soil layer is a function of root depth penetration. The prediction of yield is based on the determination of a harvest index (grain yield/aboveground biomass). Although an approach based on the prediction of yield components could be used, the harvest index seems more conservative and reliable for a generic crop simulator. The harvest index is determined using as base the unstressed harvest index, a required crop input parameter, modified according to crop stress (water and nitrogen) intensity and sensitivity during flowering and grain filling.
The weather file includes information such as latitude, weather file code name and directories, rainfall intensity parameters (for erosion prediction), freezing climate parameters (for locations where soil might freeze), and local parameters to generate daily solar radiation and vapor pressure deficit values.
The Soil file includes surface soil Cation Exchange Capacity and pH, required for ammonia volatilization, parameters for the curve number approach (runoff calculation), surface soil texture (for erosion calculation), and five parameters specified by soil layer: Layer thickness, Field Capacity, Permanent Wilting Point, Bulk Density, and Bypass Coefficient. The latter is an empirical parameter to add dispersion to solute transport, particularly when using the cascading approach for soil water redistribution.
The Management file includes automatic and scheduled management events. Automatic events (irrigation and nitrogen fertilization) are generally specified to provide optimum management for maximum growth, although irrigation can be also set for deficit irrigation. Management events can be scheduled using actual date, relative date (relative to year of planting), or using synchronization with phenological events (e.g., number of days after flowering). Scheduled events include irrigation (application date, amount, chemical or salinity content), nitrogen fertilization (application date, amount, source- organic and inorganic-, and application mode- broadcast, incorporated, injected), tillage operations (primary and secondary tillage operations, which are basically related to residue fate), and residue management (grazing, burning, chopping, etc.).
The Crop file allows users to select parameters to represent different crops and crop cultivars using a common set of parameters. This file is structured in the following sections: Phenology (thermal time requirements to reach specific growth stages, modulated by photoperiod and vernalization requirements if needed), Morphology (Maximum LAI, root depth, specific leaf area and other parameters defining canopy and root characteristics), Growth (transpiration-use efficiency normalized by VPD, light-use efficiency, stress response parameters, etc.), Residue (decomposition and shading parameters for crop residues), Nitrogen Parameters (defining crop N demand and root uptake), Harvest Index (unstressed harvest index and stress sensitivity parameters), and Salinity Tolerance.
| Crop | Location | n | Obs. Mean kg/ha | Sim. Mean kg/ha | RMSE kg/ha | RMSE/ Obs. Mean | d | ||
| Wheat | Northern Syria | G | W/N | 16 | 2180 | 2410 | 550 | 0.25 | 0.92 |
| Wheat | Northern Syria | B | W/N | 16 | 7310 | 7090 | 870 | 0.12 | 0.96 |
| Wheat | Northern Syria | G | W/N | 16 | 1750 | 2080 | 560 | 0.32 | 0.90 |
| Wheat | Northern Syria | B | W/N | 16 | 7190 | 7140 | 1030 | 0.14 | 0.92 |
| Corn | Davis, CA ; Ft Collins, CO | G | W | 28 | 9831 | 9026 | 724 | 0.081 | 0.95 |
| Davis, CA ; Ft Collins, CO | B | W | 28 | 16460 | 16808 | 1246 | 0.076 | 0.954 | |
| Wheat | Logan, UT | G | W | 18 | 4100 | 4261 | 443 | 0.108 | 0.979 |
| Logan, UT | B | W | 18 | 8033 | 8460 | 1121 | 0.14 | 0.961 | |
| Wheat | Logan, UT | G | W/N | 30 | 4946 | 4963 | 383 | 0.077 | 0.975 |
| Logan, UT | B | W/N | 30 | 10293 | 10339 | 786 | 0.076 | 0.996 |
d = Willmott Index of Agreement (Willmott, 1982), ranging from 0 to 1, 1 being perfect agreement
B = Biomass, G = Grain Yield
W = Water treatments were imposed, N = Nitrogen treatments were imposed
Recent validation work was performed using data collected by the Institut National de la Recherche Agronomique (INRA) at Auzeville (near Toulouse), France (Stockle et al., 1996). These data are from long-term cropping system experiments conducted from 1983 to 1992 to evaluate crop rotations at three input levels. Input level I was unirrigated and received a minimum amount of fertilization; level II received limited irrigation, restricted to the most sensitive growth phases, and a moderate amount of fertilization; and level III received full irrigation and a large amount of fertilization. The objective was to evaluate the ability of CropSyst to predict ET, biomass, and yield of maize, sorghum, and soybean in response to weather (three dry years: 1986, 1989, and 1990) and soil water availability. In addition, simulations were performed using four combinations of two ET and two infiltration/redistribution submodels. The ET submodels corresponded to the Penman-Monteith (P-M) and Priestley-Taylor (P-T) equations, the latter applied with a VPD-dependent P-T coefficient. Infiltration/redistribution submodels corresponded to the cascading [C] method and the finite difference (FD) method. CropSyst was found able to simulate well the observed ET, biomass, and grain yield for the three crops, three years, and three irrigation input levels as given by Wilmott index of agreement consistently over 0.95. Results in Table 2, which include only crop yield simulations, show that the best simulations tended to be associated with the use of the P-M ET and the FD water transport submodels. However, results using the simpler methods are not too different, which is encouraging for applications where data input or computer CPU time constraints may be an issue.
| Sorghum | PM/FD | PM/C | PT/FD | PT/C | |
| Number of data points | 8 | 8 | 8 | 8 | |
| Observed average (Oavg) (kg/ha) | 7601 | 7601 | 7601 | 7601 | |
| Predicted average (kg/ha) | 8060 | 7852 | 8822 | 8679 | |
| RMSE (kg/ha) | 935 | 860 | 1531 | 1339 | |
| RMSE / Oavg | 0.123 | 0.113 | 0.201 | 0.176 | |
| Wilmott index of agreement | 0.963 | 0.968 | 0.911 | 0.931 | |
| Soybean | PM/FD | PM/C | PT/FD | PT/C | |
| Number of data points | 9 | 9 | 9 | 9 | |
| Observed average (Oavg) (kg/ha) | 2828 | 2828 | 2828 | 2828 | |
| Predicted average (kg/ha) | 2738 | 2819 | 2984 | 3093 | |
| RMSE (kg/ha) | 356 | 398 | 395 | 473 | |
| RMSE / Oavg | 0.126 | 0.141 | 0.140 | 0.167 | |
| Wilmott index of agreement | 0.975 | 0.965 | 0.972 | 0.955 | |
| Maize | PM/FD | PM/C | PT/FD | PT/C | |
| Number of data points | 9 | 9 | 9 | 9 | |
| Observed average (Oavg) (kg/ha) | 8026 | 8026 | 8026 | 8026 | |
| Predicted average (kg/ha) | 7494 | 7503 | 8029 | 8064 | |
| RMSE (kg/ha) | 1858 | 2043 | 2001 | 2108 | |
| RMSE / Oavg | 0.231 | 0.255 | 0.249 | 0.263 | |
| Wilmott index of agreement | 0.958 | 0.946 | 0.952 | 0.943 |
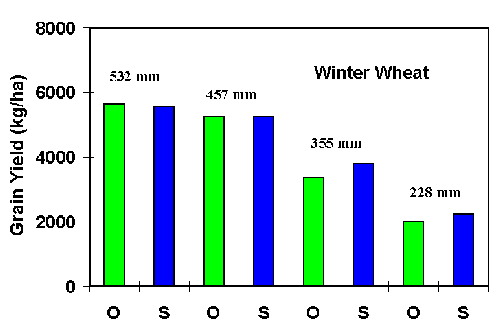
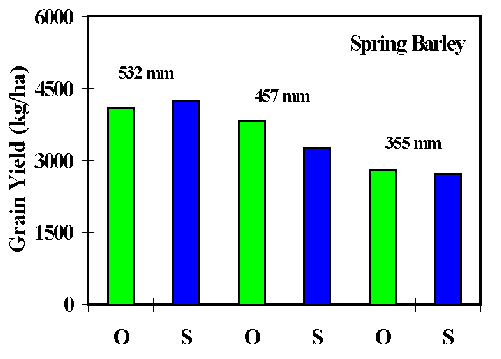
Work under progress is applying CropSyst to study the economic risk of selected crop rotations in the Palouse region of the Pacific Northwest, USA. This is a dryland region characterized by steep gradients of precipitation fluctuating from 200 to 500 mm., with weather conditions ranging from excellent to marginal for small grain. Crop rotations evaluated include Winter Wheat/Spring Barley/Spring Peas, Winter Wheat/ Spring Peas, Winter Wheat/Spring Barley/Fallow, Winter Wheat/Fallow, and continuous Spring Barley. Thirty-year average yield of the different crops within typical rotations have been compared with long-term farm-level yield averages. Both the simulated average and the coefficient of variation for the three crops compared well with observed values. Comparisons for winter wheat and spring barley are shown across the rainfall gradient (Fig. 1).
Figure 1. Simulated and observed long-term yields for winter wheat and spring barley in typical rotations at the Palouse region of the Pacific Northwest, USA (S = Simulated, O = Observed).